Pheromone-baited trap trees: what they show and what they miss
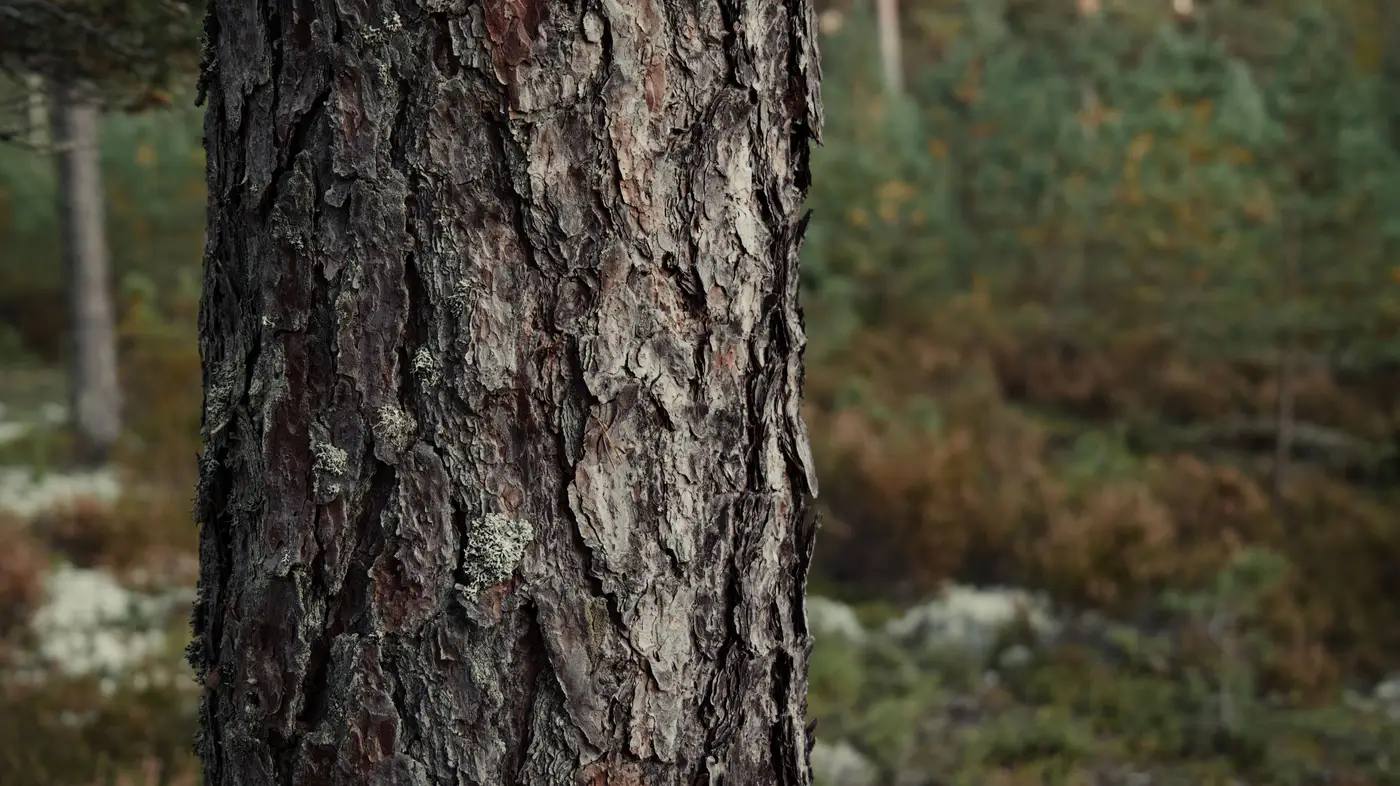
A pheromone-baited trap tree is a standing tree (or occasionally a felled bolt) rigged with a synthetic aggregation pheromone to pull in flying beetles from the surrounding stand and concentrate them in one spot you can check. Crews hang a dispenser, usually a sachet or bubble-cap lure that mimics the pheromone beetles release once they've bored into a host, on the trunk at breast height or slightly above. The scent tells passing beetles "this tree is already colonized, pile in," and they do, often in numbers well above what that tree would draw on its own.
It's one of the oldest tools in bark beetle monitoring, predating any kind of remote sensing by decades, and it still earns its keep on a lot of programs because it's cheap, low-tech, and gives you a direct count instead of an inference.
How the pheromone pulls beetles in
Most trap-tree lures replicate the aggregation pheromone a pioneer beetle releases after a successful attack, sometimes blended with host volatiles like alpha-pinene to boost the draw. The combination signals "mass attack in progress, favorable host, join us," which is exactly the message that triggers the swarm behavior that overwhelms a tree's defenses in the field. Put that lure on an otherwise healthy, unstressed tree and you can trigger a successful attack on a specimen that would normally have fought it off.
Dispenser strength and placement matter more than people expect. Too weak a lure and you get a trickle of beetles instead of a mass attack. Hung too low or on the shaded side, and you miss the flight pattern entirely for some species. Programs that have run the same trap-tree protocol for years tend to have a house recipe: lure brand, height, spacing from the stand edge, all dialed in from past seasons' catch counts.
What a trap tree network tells a program
Once a trap tree is down or stripped, crews peel bark or count entrance holes to get a density figure, beetles per square meter of bark, or just a gallery count. Run the same bait at the same sites year over year and you get a beetle population trend plot: a rough read on whether pressure in that compartment is climbing, flat, or falling off. It's a sentinel, not a census. One tree's catch doesn't tell you what's happening three ridges over, and a single bad year of lure supply or weather can throw the count without pressure having changed.
That's the honest limitation most field guides skip past. Trap-tree data is a point estimate at a handful of locations, repeated on a cadence crews can actually sustain, usually once a flight season with maybe a mid-season check. It tells you population pressure is building somewhere in the landscape. It doesn't tell you which stands are already past the red-attack window and sliding into grey, and it can't tell you that at the resolution a salvage harvest decision needs.
Where trend plots stop and stand-level staging starts
This is the gap programs usually fill with aerial survey flights or ground crew sweeps, both of which run on their own schedules and neither of which covers every compartment every month. A trap-tree network tells you beetle pressure is up basin-wide. It won't tell you that Stand 14 crossed from red-attack into grey-attack last month while Stand 22 is still fresh red and worth getting a salvage crew into before the wood checks and the sawlog value drops.
Programs that need that stand-by-stand staging, not just a population trend line, are pairing trap-tree networks with a monthly scored layer built from high-resolution multispectral imagery. Bark Beetle Detection tracks the red-attack to grey-attack color progression across a forest health monitoring area and hands back a stage-by-stand register, so the trap-tree trend plot tells you pressure is rising and the imagery tells you exactly which stands to prioritize while the wood's still worth cutting.
If your program's trap-tree counts are climbing and you need to know which stands to send the salvage crews to first, that monthly stage read is worth a look.